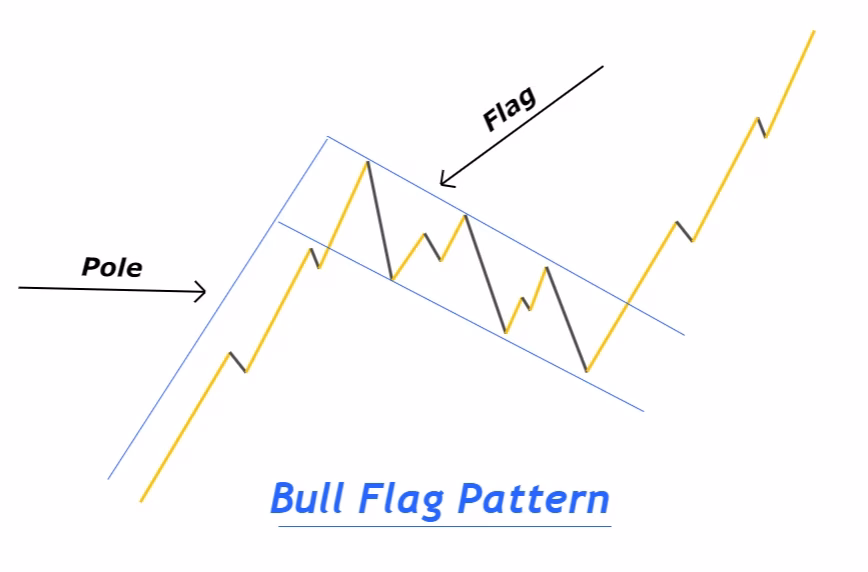
A bull flag pattern appears on a chart when a stock seems to be in a strong uptrend. It’s called a flag pattern since it looks like a flag on some pole on a chart, and because we’re in an uptrend, it’s regarded as a “bullish flag.”
The following characteristics distinguish a bullish flag pattern:
- The stock has risen sharply on high relative volume, creating the pole.
- The stock consolidates at the top of the pole on lighter volume, forming the flag.
- The equity emerged from a consolidation pattern on high relative volume, indicating that the trend will continue.
Below is a rule of thumb for traders using bull flag patterns:
- The stock surges on high relative volume, most likely due to a news catalyst.
- With a clear pullback pattern, prices consolidate at or relatively close to all-time highs.
- When prices break out of the consolidation pattern on high volume, it’s time to buy.
- Set your stop order below the bottom of the consolidation pattern.
- Profit targets should have a risk/reward ratio of at least 2:1.
Volume is the most important thing to look for in this pattern. Volume verifies significant moves and the likelihood of a successful breakout.
Decending trend line
The second thing to look for is a definite descending trend line that you can use to determine the breakout point. It will be the flag’s top portion.
Bull flag pattern chart have a statistical advantage when traded correctly, but you must know where to exit if the setup fails. Or, more precisely, the point on the chart at which you know that this setup is no longer working and it’s time to abandon ship.
You can manage this trade in a variety of ways. The most common method is to stop just below the consolidation area. At this point, you realize that such a setup is no longer viable.
You can also use the 20-day moving average as a stop. So, if prices fall below that moving average, you will exit your position.
Bull Flag vs. Bear Flag
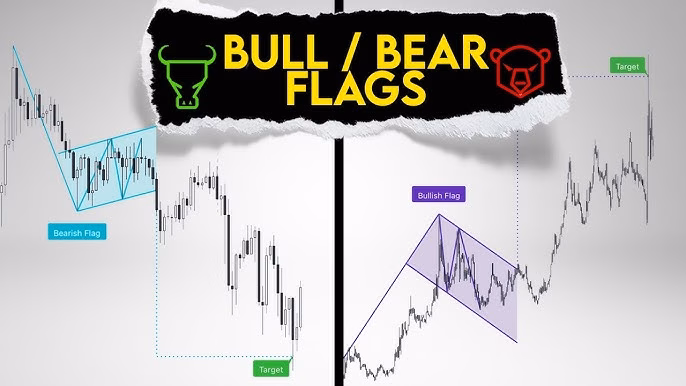
A bear flag is the same as a bull flag, except the trend is upside down. A minor pullback will follow a drastic down move on the high relative volume before the trend continues.
The best approach to trading flag patterns is to pay attention to the volume. Once volume happens to come in on the breakout, you should jump on board because it confirms that most other traders were waiting for about the same thing, which increases your chances of success dramatically.
Bull Flag vs. Flat Top Breakout
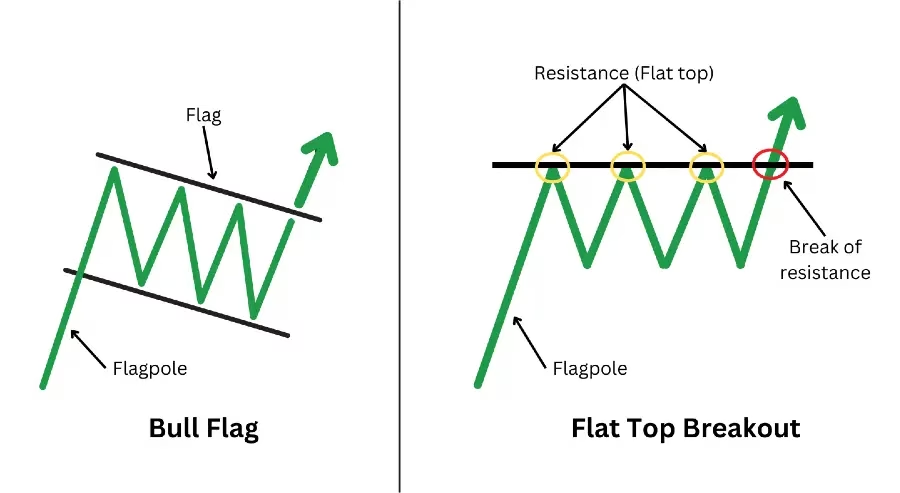
The main difference between trading a bull flag stock pattern and a flat top breakout is that the consolidation occurs below the high. As a flat top breakout consolidates close to the highs, a bull flag pattern will typically experience 2-3 red candles of pullback. It may even pull back to the faster moving averages, such as the 8 or 10 EMA.
The critical point to remember is to trade bull flags only on the best stocks! It is not about trading the best patterns; instead, it is only about the most robust equities.
Conclusion
Bull flag chart pattern are an excellent setup for beginners because they are simple to identify and trade when you understand their mechanics. Volume, like in most patterns, must be existent on the breakout. It confirms the pattern and raises the likelihood of a successful breakout.
Also check:- How to Elevate Your Option Trading Experience